
Part 2 - Documentation
2.1 Starting Report Runner Monitor and Debugger
The Monitor and Debugger should always be run as Administrator. Why? Because of two critical features provided by the application... listing Report Runner tasks and listing schedules (and modifying task credentials) from the Windows Task Scheduler (more on both of these topics later). If you do not run the application with elevated credentials, it is unable to run the Windows API query to fetch the processes and schedules.
If you have configured the application to be run as Administrator, your icon might look like this (notice the shield added to the icon). We say "might", because not all machines will show a different icon.
![]()
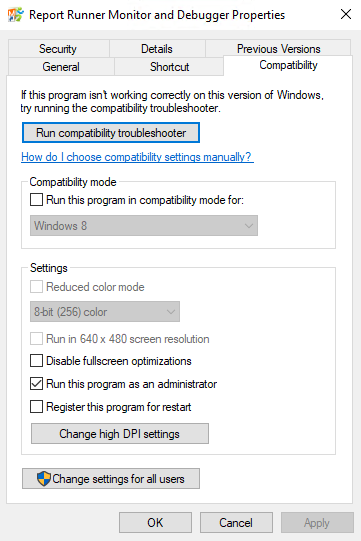
To set the application to run as Administrator, just right-click on the icon, click on Compatibility tab, and select/check the option "Run this program as an administrator".
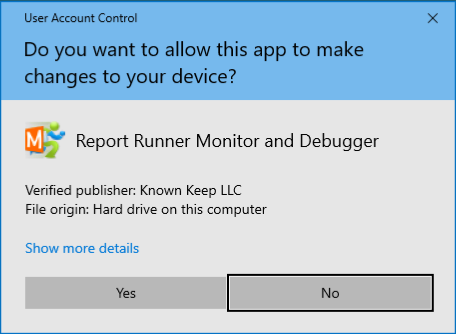
Once you double-click the icon to run the Monitor and Debugger application, you may still get prompted to run as Administrator with this pop-up... just click Yes to continue.
2.2 Process Analysis
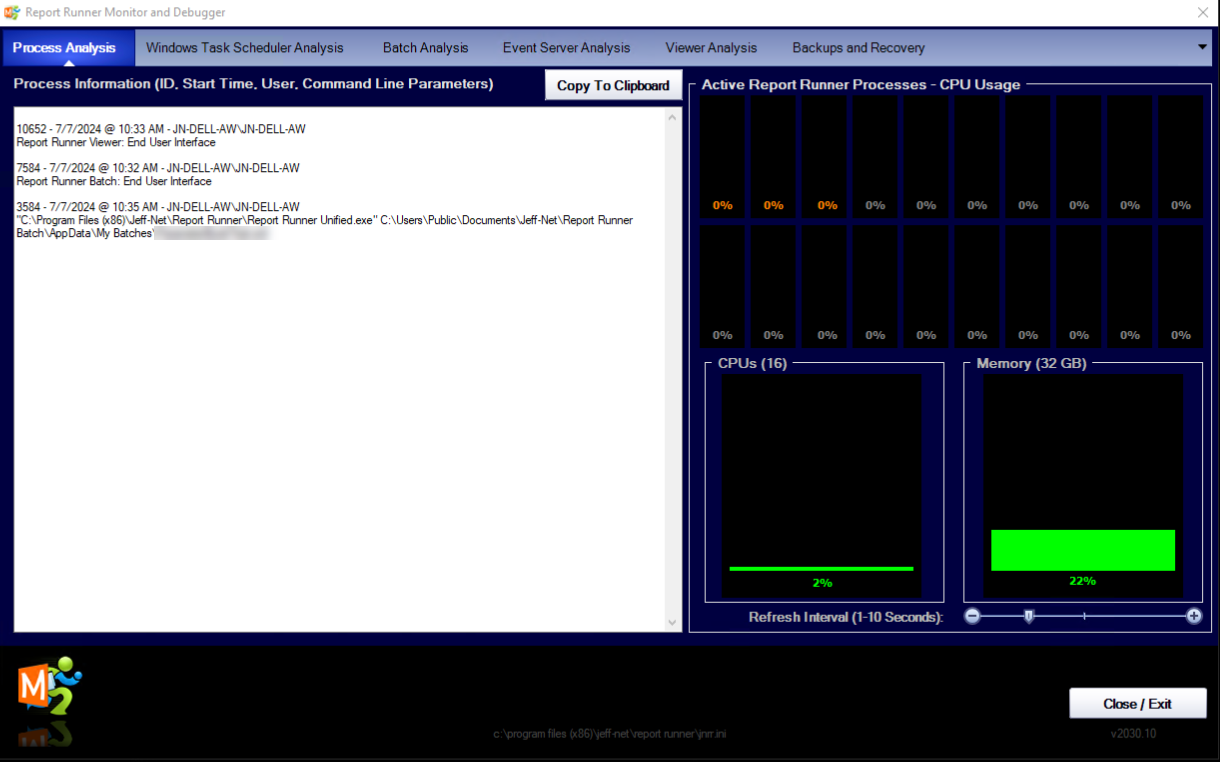
The Process Analysis tab is the first/default tab selected when you start the application. This interface will list out all of the Report Runner processes currently running on this machine. On the right half of this window, you'll see CPU usage per process, overall CPU usage (and total CPUs installed in machine), and total memory installed and currently in use in machine. You can modify how fast this interface refreshes from 1 to 10 seconds. We recommend a setting of around 3-5 seconds.
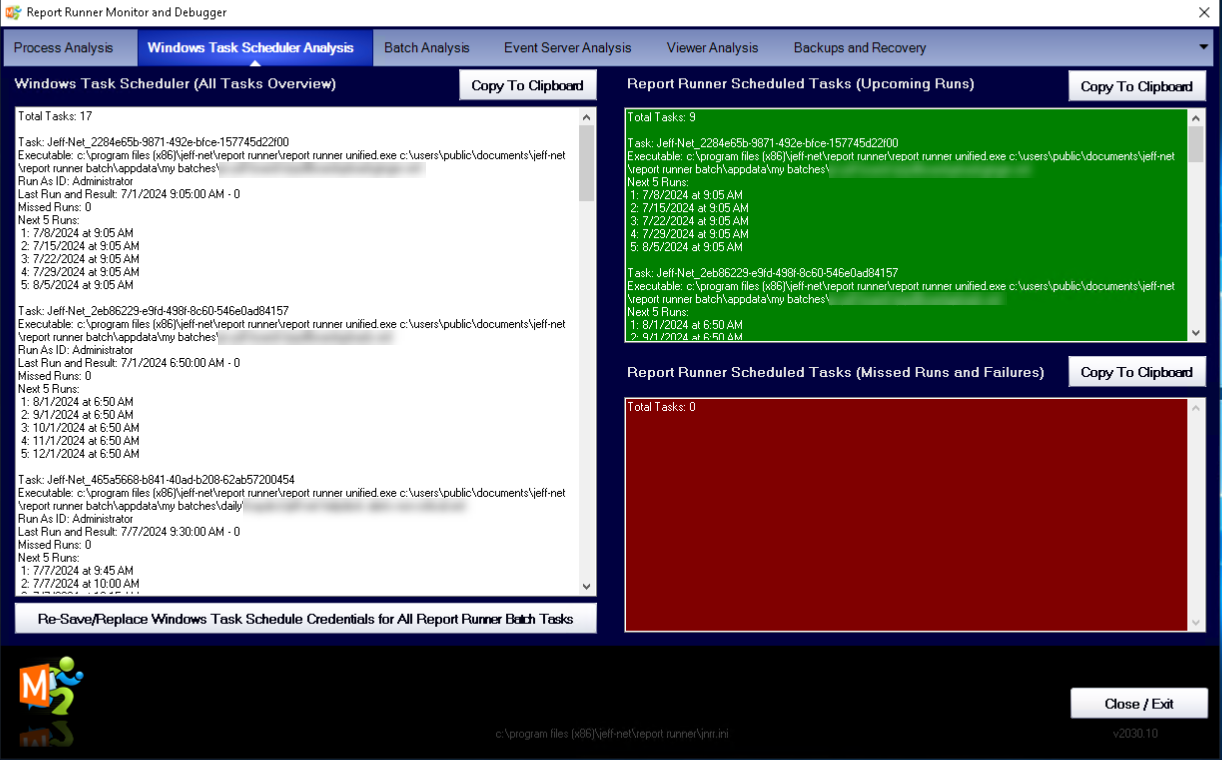
2.3 Windows Task Scheduler Analysis
The second tab you can select is the Windows Task Scheduler Analysis tab. This layout has four main features:
- A display of ALL Windows tasks on the left and next 5 runs (black on white)
- A display of ONLY Report Runner Batch tasks and next 5 runs (white on green)
- A display of ONLY failures or (possible) missed runs of Report Runner Batch (white on red)
- A button near the bottom left which allows for mass updating of Windows task credentials. For example, if your company security policies require frequent changes to credentials, you can mass update any schedules with this function.
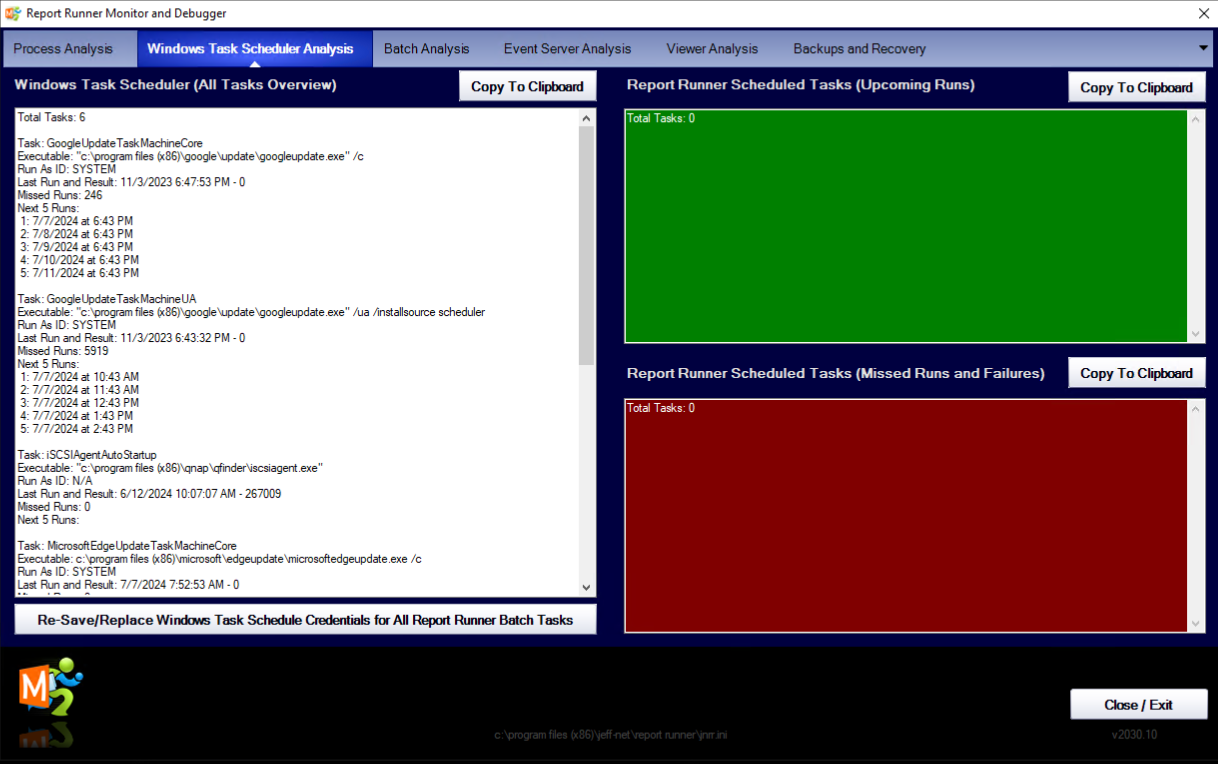
You may have noticed in the previous screenshot there were no Report Runner Batch schedules shown. This was to emphasize that the left side (white on black) shows ALL Windows scheduled tasks.
Here's a good example of what a typical Report Runner Batch screen might look like. In this case, there are 9 Report Runner Batch schedules.
Note: The "Copy to Clipboard" option copies all text from that "box" so you can paste it into a text document (like Notepad) for review and/or printing.
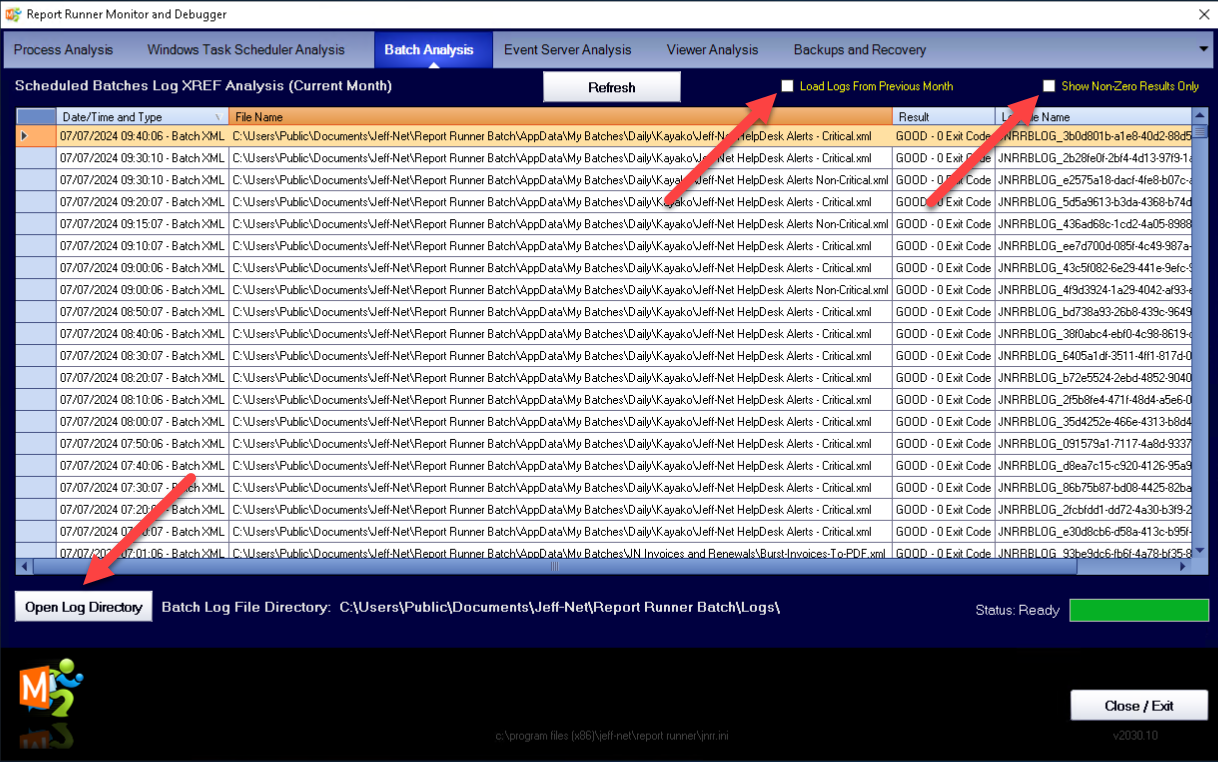
2.4 Batch Analysis
The third tab you can select is the Batch Analysis tab. This interface provides an easy way to review log files. Depending on the number of schedules that you run monthly, this interface may take a few seconds to load. There is a status bar of the load in the bottom right corner.
![]()
Once loaded, there are a few things you can do.
- Load logs from the previous month (click/select the check box). By default, only logs from the current month are loaded. And only logs of SCHEDULED batches or AUTOMATED batches (think Event Server) are loaded. Batches that you ran manually from the main Report Runner Batch interface are NOT shown here.
- Show ONLY logs where these batches did not complete successfully (click/select the check box).
- If you double-click on of the lines/records, it will open the log file for review.
- Open the log file directory (click the button near the bottom left). This will open the log file directory where you can see ALL logs from the last 30 days. We have automatic maintenance that keeps these logs reduced to the last 30 days.
Additional Batch Knowledge Base Articles:
- What's a log file and how do I find it?
- Scheduled Reports Won't Run --- What's The Problem?
- What permissions are needed for the Report Runner Batch User when scheduling a task?
- Error 0x80070005 (E_ACCESSDENIED) Trying to Add/Create/Save a New Task Schedule to Windows Task Scheduler
- Windows Task Scheduler Fails With Error Code 2147943785
2.5 Event Server Analysis
The fourth tab you can select is the Event Server (Rules) Analysis tab. This interface also provides an easy way to review log files. Depending on the number of rules that you run daily (and every X minutes), this interface may take a few seconds to load. There is a status bar of the load in the bottom right corner.
Note: The Event Server Analysis loads logs for TODAY ONLY. Why? Since rules run 24x7x365, they are either working or they are not. And if they are not, you don't need to load a months worth of logs. Additionally, since these logs are automatically maintained to be retained for only 3 days, there would never be a more than that to load anyway.
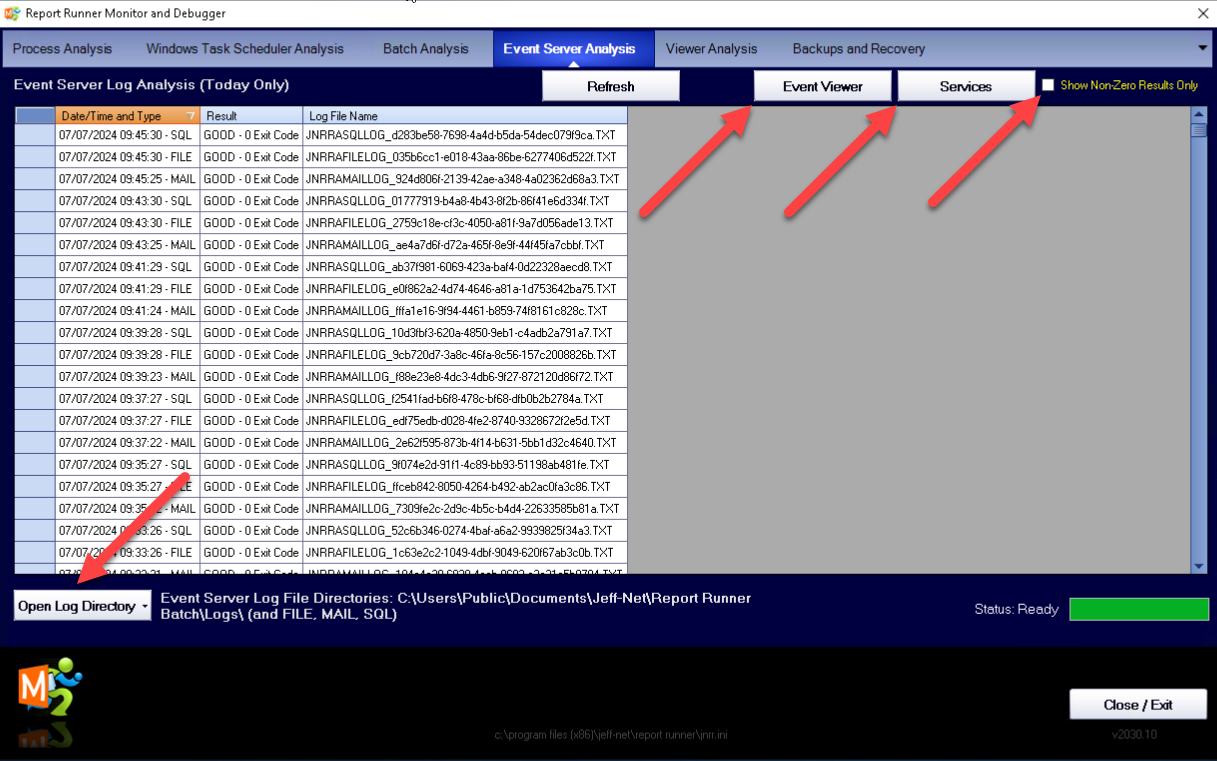
Once loaded, there are a few things you can do.
Types of Rules/Logs:
- MAIL: Trigger batches based on emails (monitors email accounts to trigger batches)
- FILE: Trigger batches based on files (monitors file locations for files to "appear"... like receiving a file via FTP)
- SQL: Trigger batches based on a SQL field value (runs SQL Select statements looking for logic like X = Y)
See this KB article for more information on the types of Report Runner Event Server rules (or rule "packs").
2.6 Viewer Analysis
The fifth tab you can select is the Viewer Analysis tab. This interface also provides an easy way to review log files. Depending on the number of reports that you run on a daily basis, this interface may take a few seconds to load. There is a status bar of the load in the bottom right corner.
Note: The Viewer Analysis also loads logs for TODAY ONLY. Since Report Runner Viewer is used to run reports interactively (not scheduled), this interface is mainly here to help you locate a log where a report failed earlier in the day, and you're not sure which log it is.
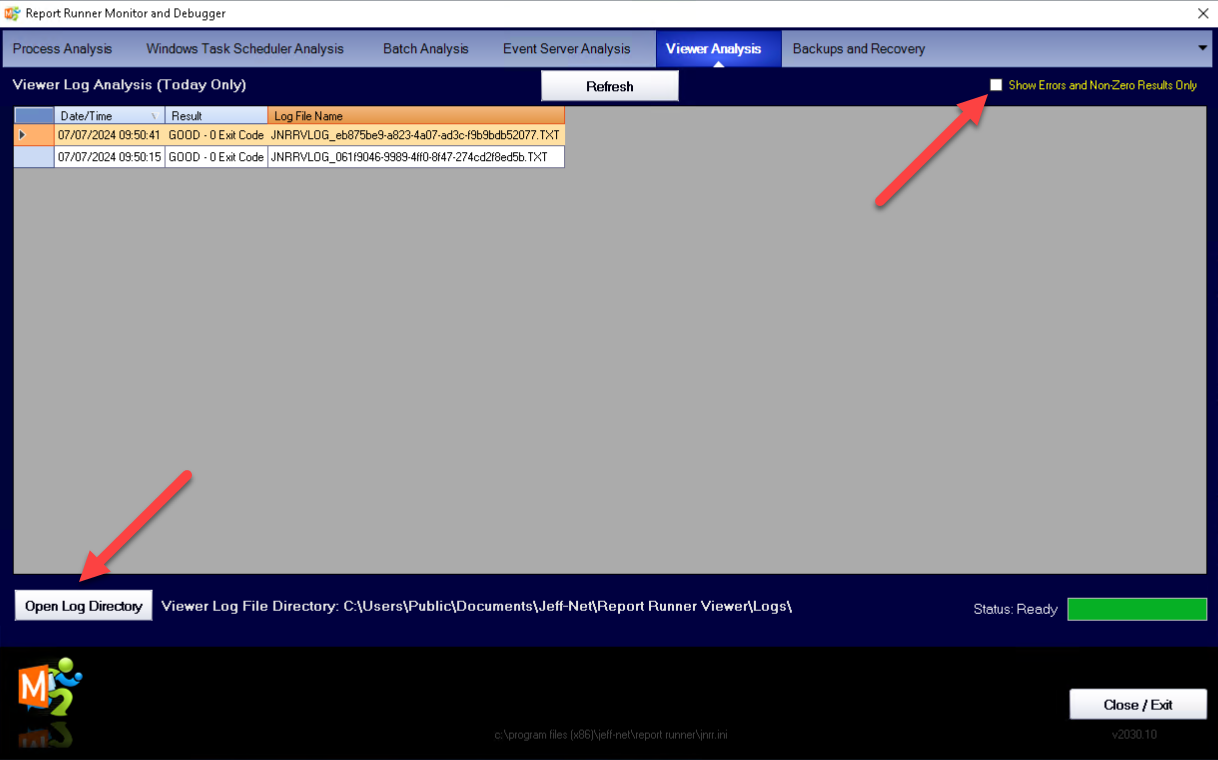
Once loaded, there are a few things you can do.
- Show ONLY logs where reports did not complete successfully (click/select the check box).
- If you double-click on of the lines/records, it will open the log file for review.
- Open the log file directory (click the button near the bottom left). This will open the log file directory where you can see ALL logs from the last 30 days. We have automatic maintenance that keeps these logs reduced to the last 30 days.
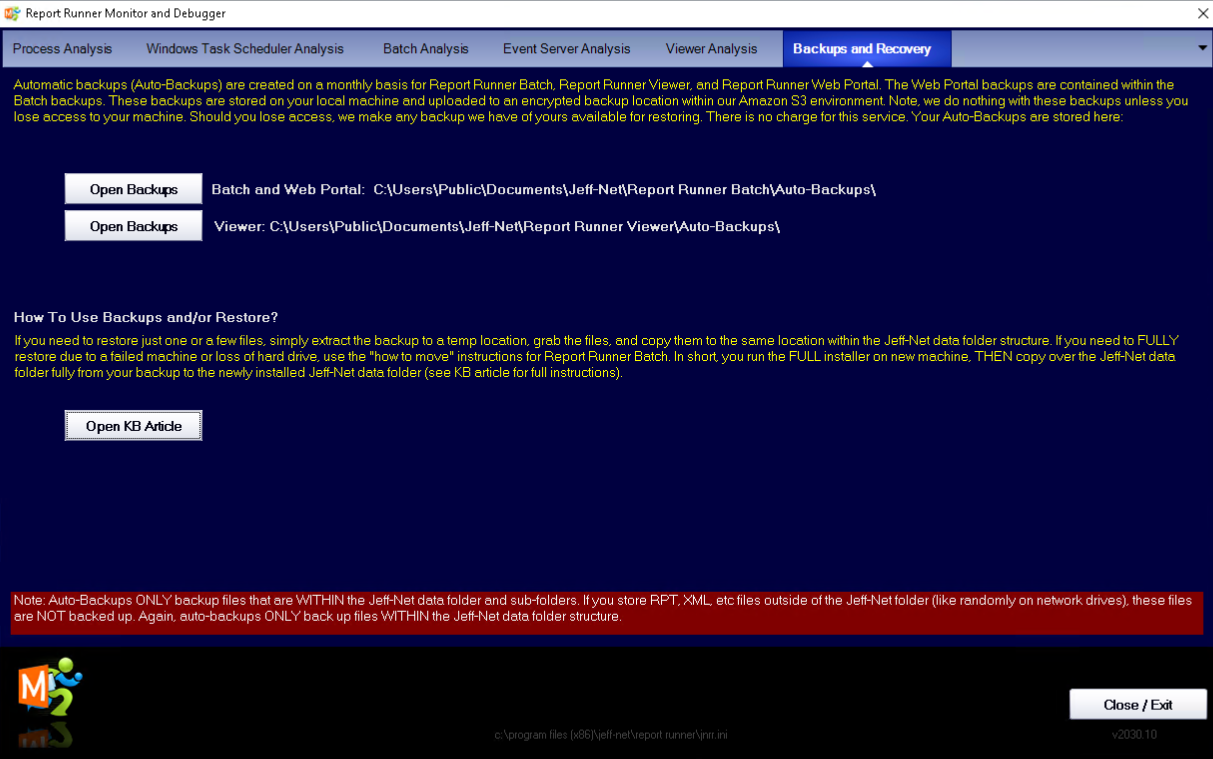
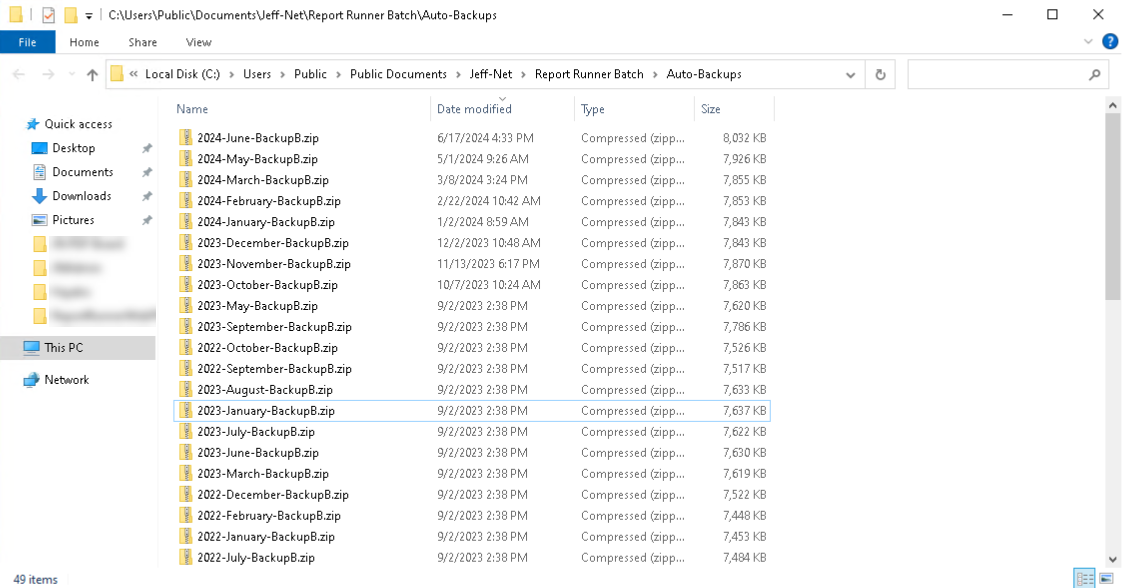
2.7 Backups and Recovery
The sixth and last tab you can select is the Backups and Recovery tab.
x
x