
Part 2 - Documentation
The way you "use" Event Server is different than our other Report Runner products. There is not an "Event Server" application interface that you start. It's a bit spread out. It will all make sense once you see the full picture, but it can be a bit confusing when you're just getting started.
Here's a list of what we will cover, because all of these "pieces" make up "Event Server":
- Service
- Controller
- Input, Processed, and Error directories
- AutoPrint directory
- Mail rules, File rules, and SQL rules
- Monitor
- Logs
The broad "TLDR" explanation of all of this is... you have a service... which will start automatically, but can be controlled by the Controller... the service monitors an Input queue for XML files to run... the service also monitors an AutoPrint queue for PDF files to print... the service also monitors SQL, File, and Mail rules which can trigger XML files to run... then there is a Monitor application which "monitors" the queues... and there are logs to document how things are running.
2.1 Service
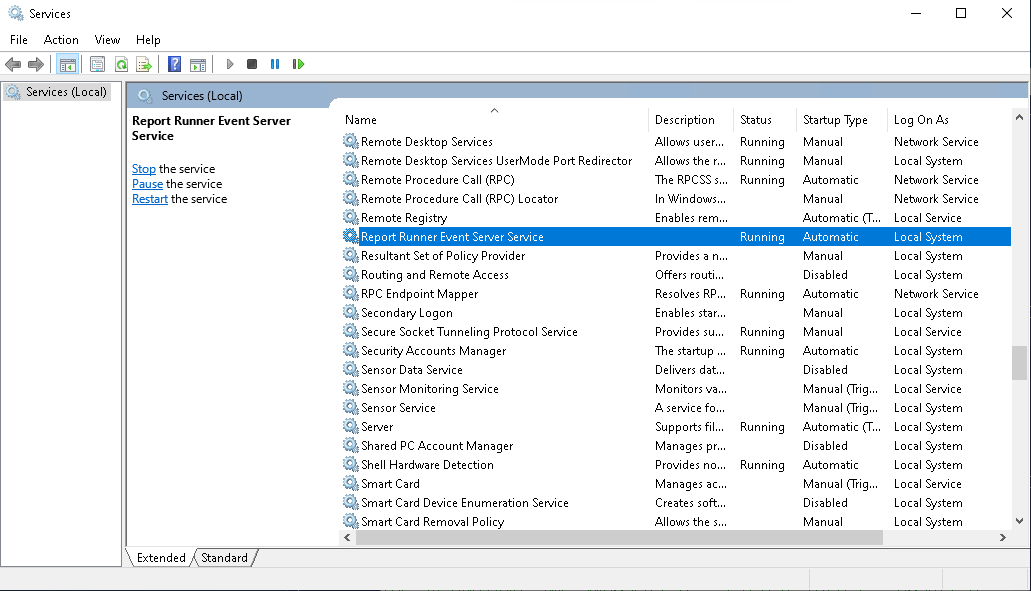
The service is named "Report Runner Event Server Service". Installing and configuring the service is covered in the installation KB article. The service itself should run 24x7x365 (all the time). It has been tuned to use very little overhead when no work is being done.
Event Server also watches for hung processes. If a report process it launched is still running after 23 hours, Event Server assumes it is hung, ends it, and notes it in the Windows Event Viewer log. You can change the number of hours with the KillLongRunningHungExesAfterXHours setting in jnrr.ini (under [Event Server]) — for example, set it to 4 to end hung processes after 4 hours, or set it to 0 to turn this off. Event Server adds this setting to jnrr.ini automatically the first time it starts, so you'll find it there ready to adjust.
2.2 Controller

There is a controller that installs to the start-up tasks (the "E" Report Runner icon), and should be available in your system tray area at all times. If you right-click on it, you have access to a pop-up menu.
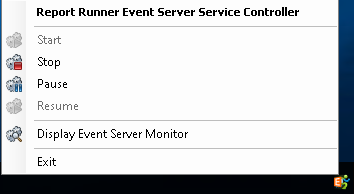
This controller can be used to control the service itself and to open the Event Server Monitor.
When you start or stop the service from the controller, it will wait up to 10 seconds for the service to respond. If the service does not reach the expected state, the controller will display a message showing the current status.
If the controller cannot read the service status (usually a permissions problem), the tray icon will show a status of "Unavailable". The controller keeps checking in the background and will return to showing the normal status on its own as soon as it can read it again. If it stays on "Unavailable", make sure the controller has proper permissions (right-click on the controller executable, display the properties, and enable the setting to Run as Administrator).
Note: while the Event Server Monitor is open, the controller menu options are temporarily disabled. Close the monitor and they will be available again.
If you exit the controller, it can be found on your desktop and in the Report Runner program group to restart it.
2.3 Input, Processed, and Error Directories
One of the functions of Event Server is to monitor an Input queue (file directory), looking for XML files to process. These XML files are Report Runner Batch XML files. If an XML file is "seen", the Event Server service will make a call to the Report Runner Batch executable (Report Runner Unified.exe) to process the XML file. Depending on the configuration you made when you installed the service, Event Server can run up to 20 processes at the same time. If you use Mail, File, or SQL rules, each active rule type reserves one of those process spots for itself so the rules can always run — for example, with all three rule types active and max batch processes set to 20, up to 17 XML files can process at once with 3 spots held for the rules. The total never goes over 20. If the XML file is processed successfully, it will move the XML file to the Processed queue (file directory). If there is a problem processing the XML file, Event Server will try it again — and if the same XML file fails 3 times, it moves it to the Error queue (file directory) automatically (instead of trying it over and over) and notes it in the Windows Event Viewer log.
Note: Event Server is used to process Web Portal reports, too. See this KB article for an overview of how that works.
These queues (or file directories) are located within the Report Runner Batch data file settings (Report Runner Batch\AppData\Event Server).

2.4 AutoPrint Directory
As seen in the previous screenshot, there is also an AutoPrint directory. This feature is used to automatically print PDF files. Many times you want to be able to randomly review mass print invoices or statements before printing them. With this feature, you can review the PDFs then do a mass copy to the AutoPrint directory (actually a sub-directory WITHIN the AutoPrint directory that matches the printer name).
Within this AutoPrint directory, you will manually create a directory with the EXACT same name of any printer you want to be able to auto-print to. For example, if you had a printer called "HP Laserjet 5000", you would create a folder/sub-directory within the AutoPrint directory with that same name. Once created, any PDF files you place in that directory would be auto-printed.
That's the basic setup. If you need to "fine tune" the printer settings, we have an INI file that goes in the directory to set or override default settings. See this KB article for more information.
2.5 Mail Rules, File Rules, and SQL Rules
Another feature of Event Server is the ability to create rules to trigger Batch XML files. These rules can be based on mail/email logic, file logic, and SQL logic.
With each of these you create specific logic and rules for Event Server to "look" for in an email, a file, or SQL. See this KB article for more information.
File rules and SQL rules share the same interval setting, but they run independently — a long-running SQL rule won't delay your File rules, and vice versa.
Interested in setting up a Send Mail token using Microsoft MSAL/Graph? See this KB article:
2.6 Monitor
The Event Server Monitor is a way to see the Input, Processed, and Error queues in action. As mentioned previously, you can start the Monitor by using the Controller.
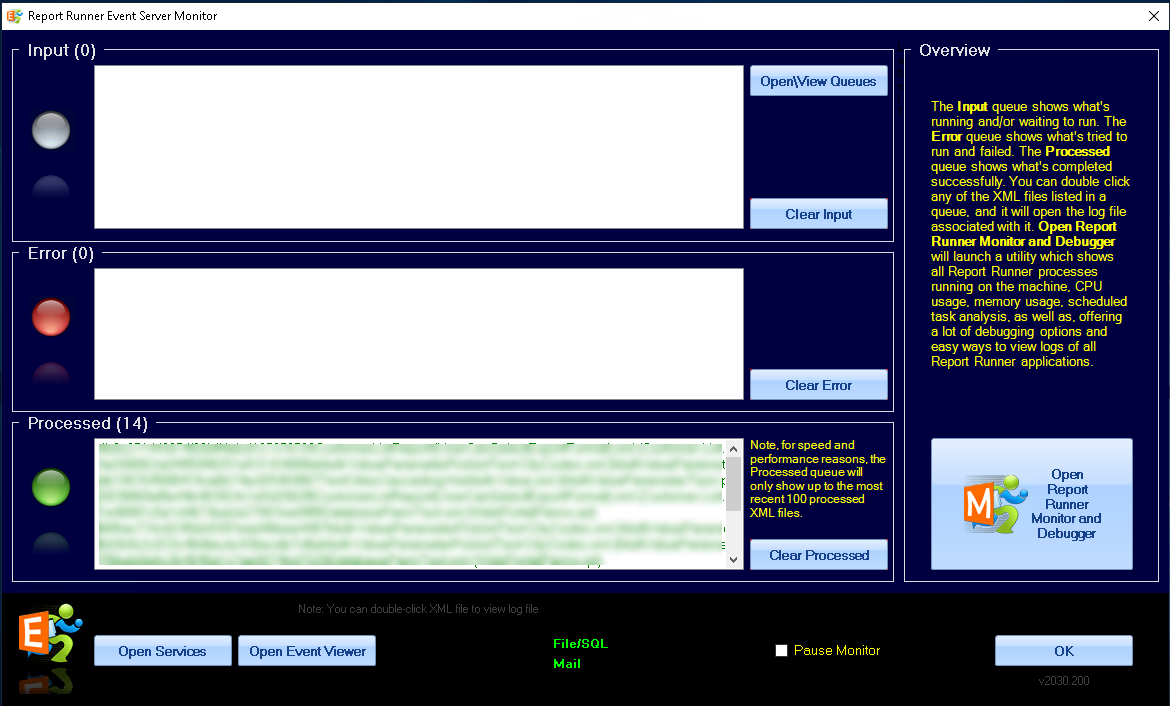
The monitor keeps your place (scroll position and selection) while it refreshes, so you can look around while it is running. If you have a lot of file (XML) activity, you can still use the Pause Monitor option to put the monitor itself on hold. Note, it does NOT pause the service itself or the processing of XML files (that's what the Controller is for).
Tip: you can double-click an XML file in any of the queues and the monitor will search the Event Server logs for it, opening the most recent log file that mentions that XML file. This is an easy way to see exactly what happened to a particular batch.
In the bottom middle of the window, you can see the words File/SQL and Mail in green. If they are green, then those rules are "on" being monitored. If it is not green, then you did not enable the monitoring of these rules when you ran the installer.
You can use the Open Report Runner Monitor and Debugger to launch our debugging "assistant". This monitor is different than the Event Server monitor. It shows all Report Runner tasks running on the current machine and various ways to analyze logs.
If you want to manually adjust the Report Runner Event Server service, you can click the Open Services button.
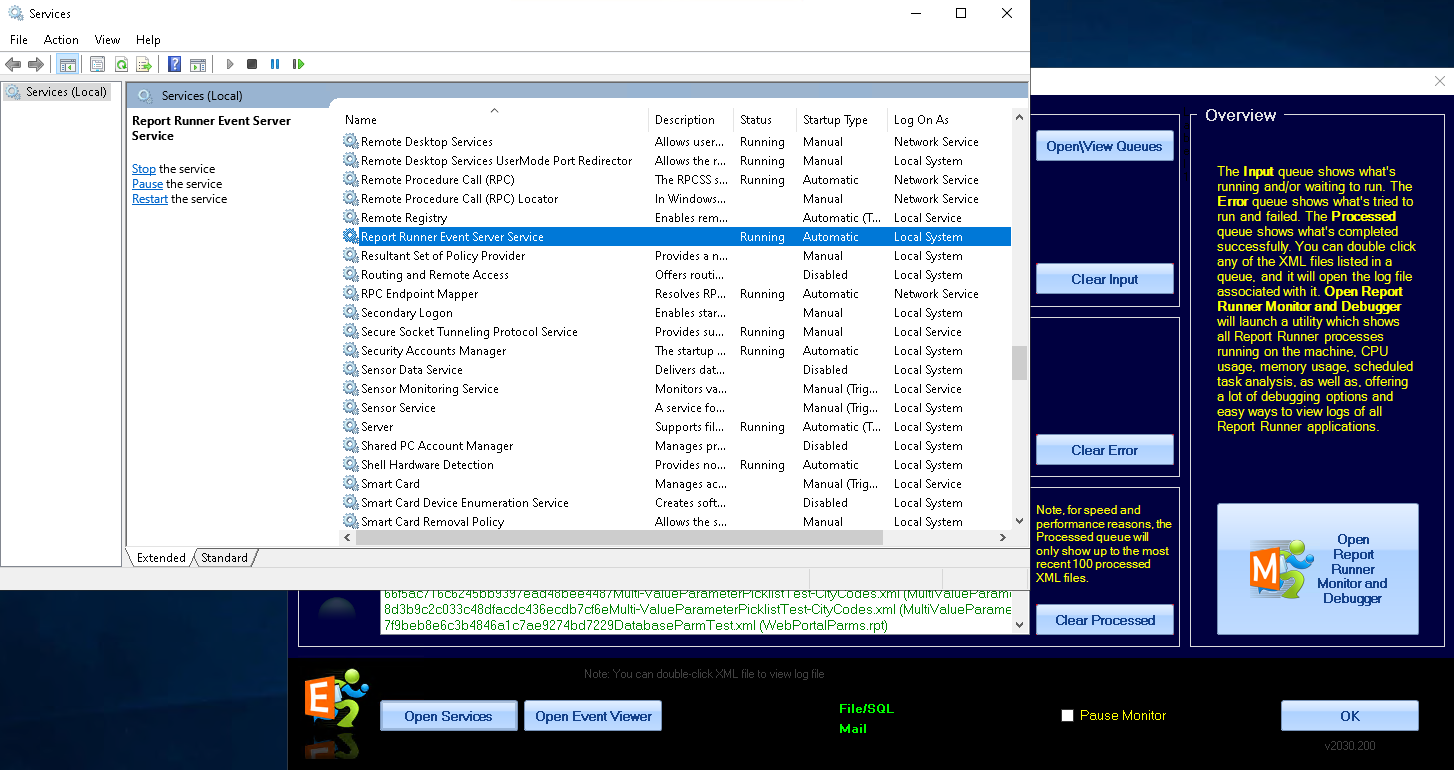
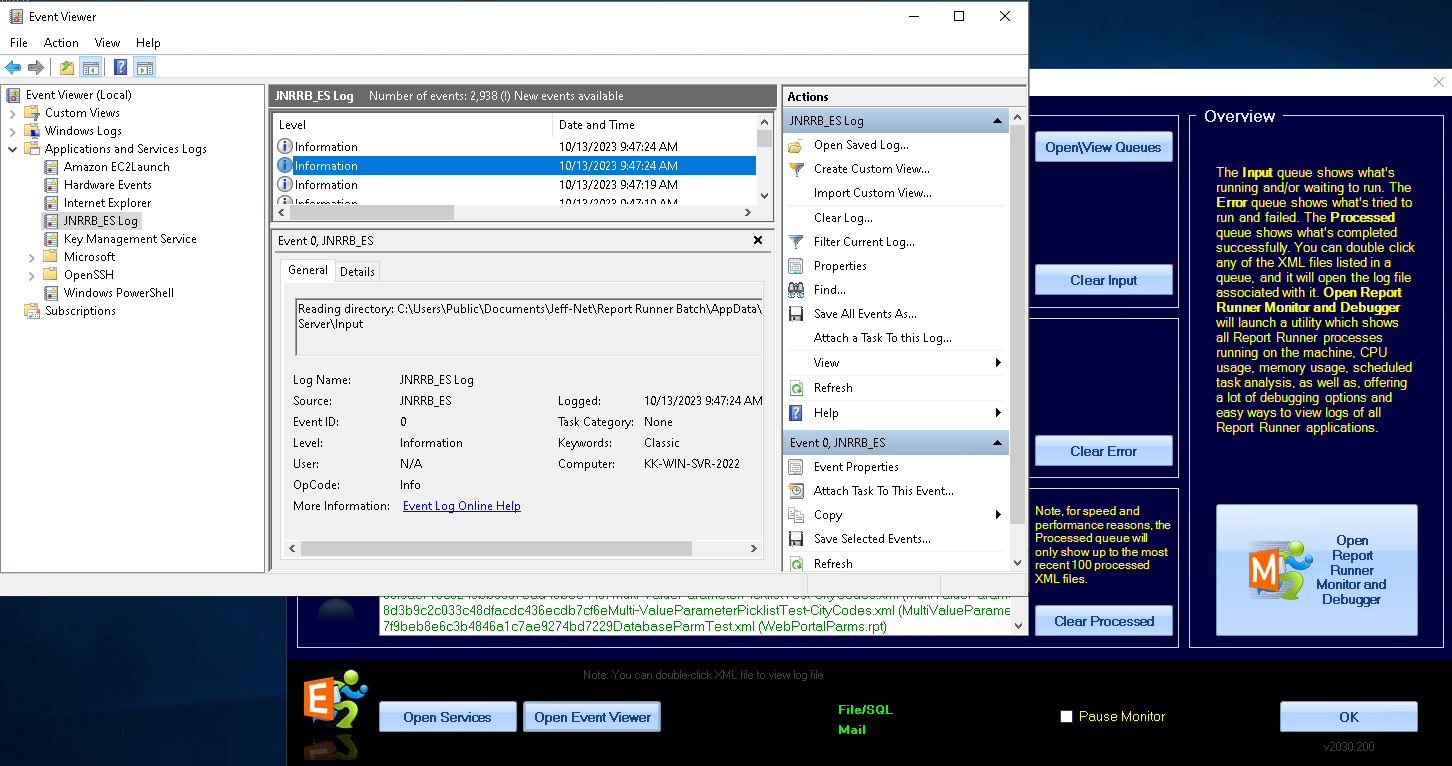
If you want to review the Windows Event Viewer logs for the service, you can click the Open Event Viewer button. This will show the log messages that Event Server is sending to Windows to show activity of the service itself.
2.7 Logs
If you've used any of our Report Runner products, you know we are famous for our log files. Event Server is no different. We log the service activity to the Event Viewer (this is standard best practices for Windows). We also log all of the activity when the Event Server service launches Report Runner Unified.exe as a "helper" task. There are frequent launches to check rules and then that task will launch the same executable to process the XML file, too (if a rule triggers an execution). Each of these processes creates logs in the Report Runner Batch log file directory.
The service writes a "Heartbeat Check" entry to the Windows Event Viewer every few minutes to show it is alive and what it has been doing — how many Input queue scans ran, how many XML files launched, how many processes are running, and the status of your rules. Errors and warnings still log the moment they happen, and if a problem stays active (like the Input queue being unreachable), it repeats with each Heartbeat Check until it clears — so a lasting problem never scrolls out of view.
There are separate logs for each type of Event Server activity. For example, if you're wondering why a mail rule is not triggering, check the Mail logs. It will show each time the mail rules run, and the decision process based on the mail that was read/processed.

Note, when an XML file is processed due to an Event Server process, it can be found in the core Batch log file directory. All triggered XML processing will also be logged in the monthly XREF log files, too. That allows you to match a log file with an XML file/process.